We have delivered many Power BI models, reports and training sessions over the last two years, and it has been enthusiastically adopted by customers. Microsoft is continually adding new features.
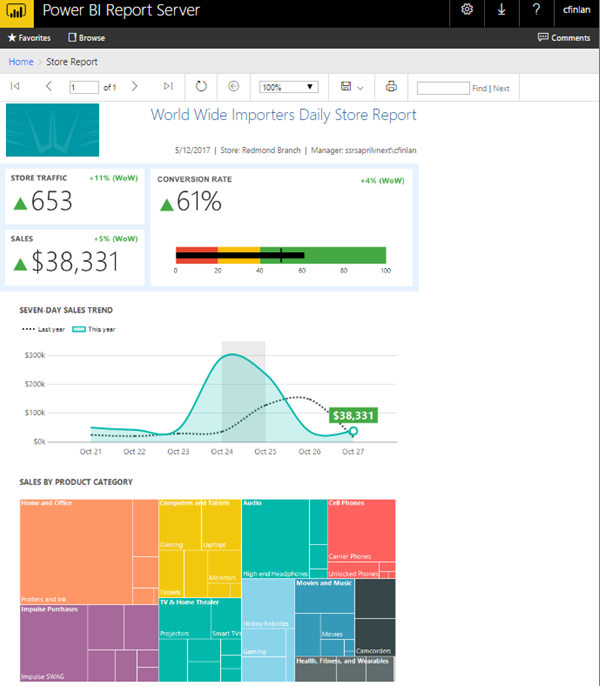
– Power BI Report Builder, is the latest companion application for Power BI that lets you author Paginated Reports is a free, standalone Windows Desktop application that can now be downloaded from the Power BI website. As the name suggests, paginated reports can run to many pages. They’re laid out in a fixed format and offer precise customization. Paginated reports are .rdl files. You can store and manage paginated reports in the Power BI Report Server web portal, just as you can in the SQL Server Reporting Services (SSRS) web portal. You create and edit them in Report Builder or Report Designer in SQL Server Data Tools (SSDT), then publish those to a web portal. Report readers in your organization can then view the reports in a browser or in a Power BI mobile app on their mobile device.
Power BI Report Builder enables you to:
•Use the Report Builder ribbon to quickly add items your reports, launch table, chart, and map wizards, and format your report data.
•Add data from built-in data providers.
•Create and use report parameters and other interactive features.
•Preview reports in HTML or print format.
•Export reports to file formats such as Microsoft Excel or PDF.
•Save your report locally
•In a future update, you’ll be able to both open and publish from/to the Power BI Service
To download and install Power BI Report Builder, you can click on the COG icon in the title bar of Power BI site and select the Report Builder option.
The March 2019 release of Power BI Desktop has brought us keyboard accessible visual interactions. One of Power BI’s natural strengths is that you can click on a data point within a visual and have it cross-highlight or cross-filter the other visuals on a page. Keyboard-only users weren’t able to use this feature until now. Interact with a visual using keyboard commands. Notice you can select specific data points within the line chart, and the other charts on the page filter based upon the selection.
