Happy New Year!
Power BI is more and more a powerful reporting and data analytics tool for Dynamics 365 Business Central and the new embedded experience will be a great addition for every customer.
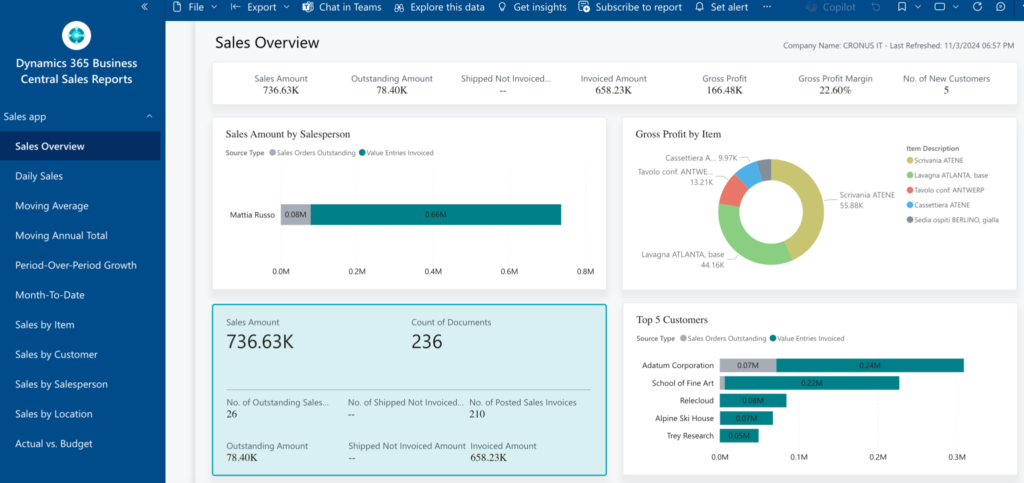
As of version 25.1 of Dynamics 365 Business Central cloud, you have access to a comprehensive set of new Power BI reports, integrated directly into the Business Central environment.
This provides end users with much better data analysis capabilities.
With Dynamics 365 Business Central version 25.1 Microsoft has silently officially released the so called “Project Yellowstone“, alias a set of embedded Power BI apps and reports that significantly enhances the KPIs and BI reporting inside the application.
In Dynamics 365 Business Central version 25.1, you have now Power BI apps for the following functional areas:
- Finance
- Sales
- Purchasing
- Inventory
- Inventory Valuation
- Warehouse
- Projects
Each app consists of two components:
- A connector (AL) app that contains APIs, setup pages, and embed pages (Power BI Reports app preinstalled in every Dynamics 365 Business Central environment).
- A set of Power BI template apps that contain a Power BI semantic model (dataset) and pre-built Power BI reports.


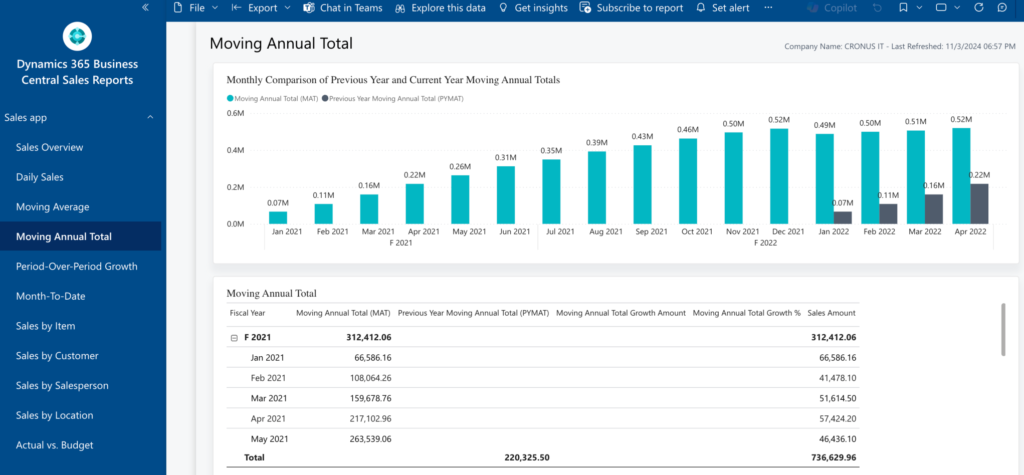
The Moving Annual Total (MAT) report calculates a total of sales over the last 12 months and showcases the sales amount moving annual total (MAT) by comparing it to the MAT for the previous period:

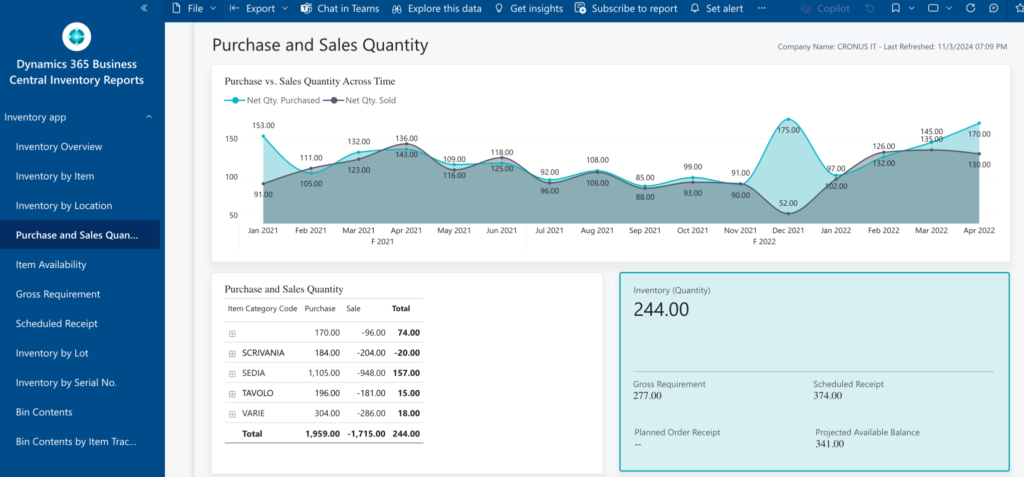
This inventory report gives great insights

Some other interesting report:
The Item Availability report, that permits you to select an item category or a single item and see how the inventory is moving (you can see when you will be out of stock):
The Sales Month-to-Date (MTD) report provides a detailed overview of the total revenue generated from sales activities from the start of the month up until the current date:
The Sales by Item report gives a clear picture of your organization’s item sales. It showcases key metrics for each item or item category. For example, the sales amount, quantities, and the cost amounts. You can break down the information further by the specific customers that buy the items.
The Daily Sales report gives a clear picture of your organization’s sales activities over specific days. The report can showcase which days have a higher volume of sales. You can also view variations across different years, quarters, or months to identify trends over time.
Projects has interesting reports to evaluate costs and budgets and WIP:
The Released Production Orders report provides detailed information about all released production orders, including expected versus finished quantities and the variance
The Detailed Customer Ledger Entries report provides a view of individual transactions from the Detailed Customer Ledger, enhanced with information from the Customer Ledger. This report is a valuable tool for tracking customer transactions, reconciliation, and facilitating efficient audits by giving easy access to detailed entry information.
To install these templates in your PBI environment, you need to have a Power BI Pro license. Each PBI reports is connected to Dynamics 365 Business Central data via APIs.
You need Power BI licenses for the following reasons:
- it is required to be able to install Power BI template apps from Microsoft AppSource.
- it is required for sharing a Power BI workspace.
You need Power BI PRO licenses for the following users:
- Users who install the Power BI template apps.
- Users who refresh the data.
- Users who access the reports.
Alternatively, you can use Power BI Premium Capacity.
The Power BI apps currently work per company in Business Central. If you have multiple companies in your Business Central environment, then you must install and set up a Power BI template app for each company.
For help with install, configuration and training or to for Power Bi licnces call us now to get the most form your reporting options with Business Central. 00971 43365589